


784043
Population (projected)
2025
4245.68 $
GDP Per Capita
2024
8.76%
GDP Growth Rate (Y-O-Y)
4th Quarter, 2025
6.07%
Inflation Rate
March 2026
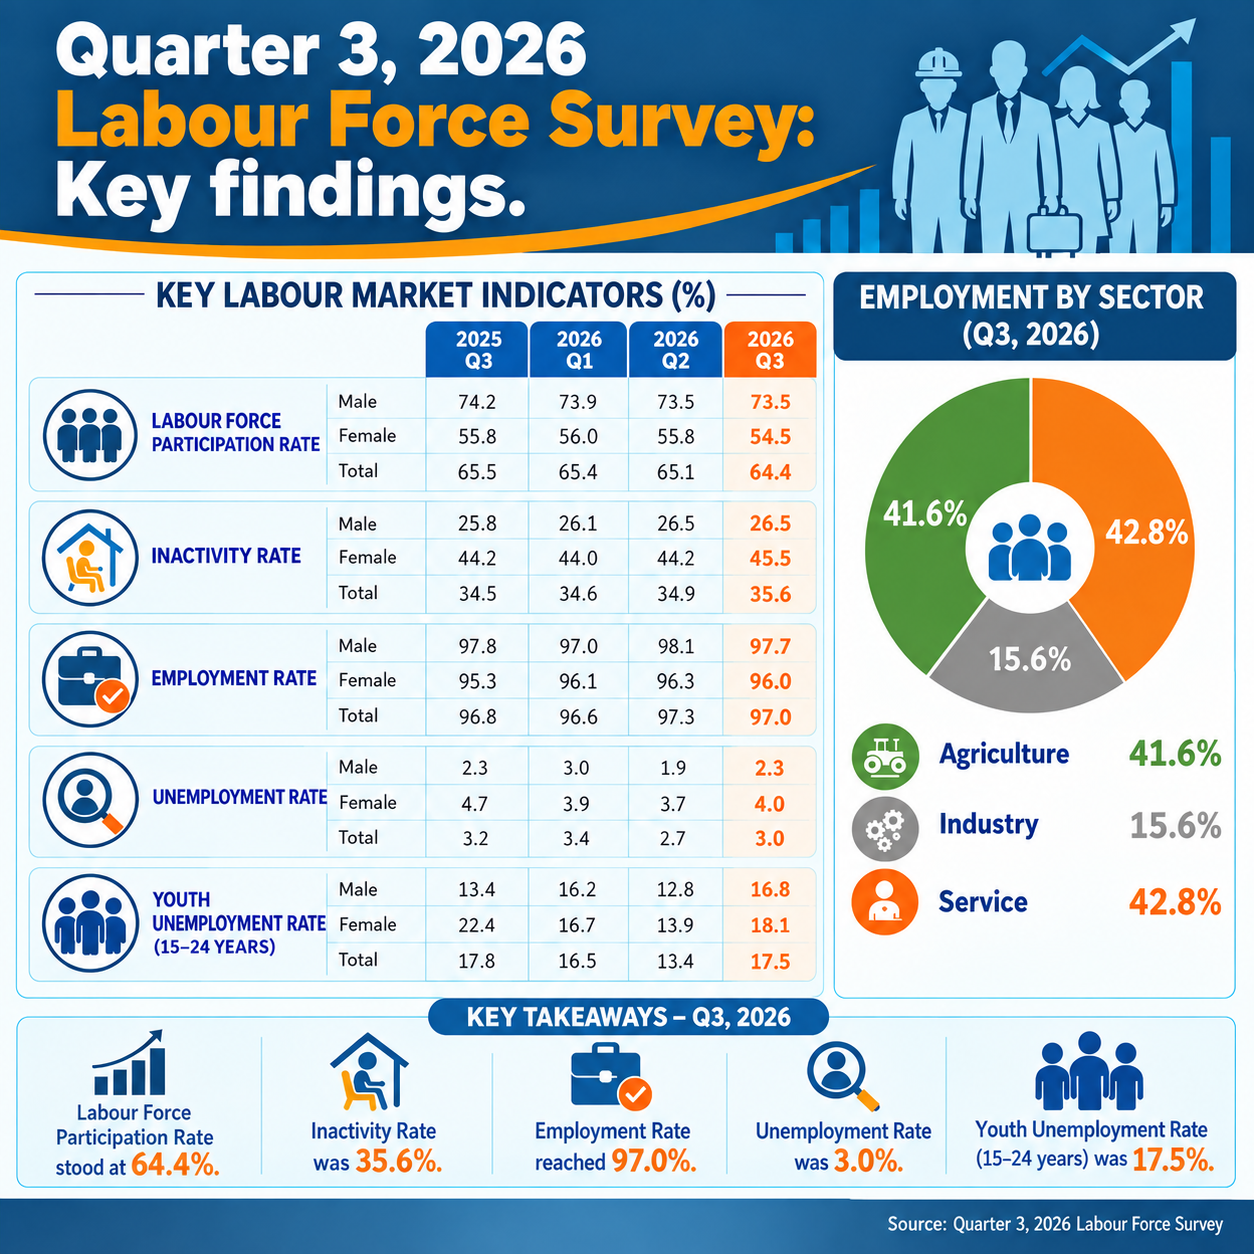
3.4%
Unemployment Rate
1st Quarter LFS, 2026
16.5%
Youth Unemployment Rate
1st Quarter LFS, 2026
63.9%
Labour Force Participation Rate
Annual Labour Force, 2024
70.6 %
General Literacy Rate
2022
64.9 %
Adult Literacy Rate
2022
12.4%
Poverty Rate
2022
Your Gateway to
Data Driven Decision Making
First Quarter Gross Domestic Product 2026
The National Statistics Bureau is pleased to release the Quarterly Gross Domestic Product,
First Quarter (Q1) 2026.
![]()
Socio-Economic Indicators for 1st Quarter, 2026
The National Statistics Bureau (NSB) is honored to present the Socio-Economic Indicators (SEI) for the First Quarter 2026.
![]()
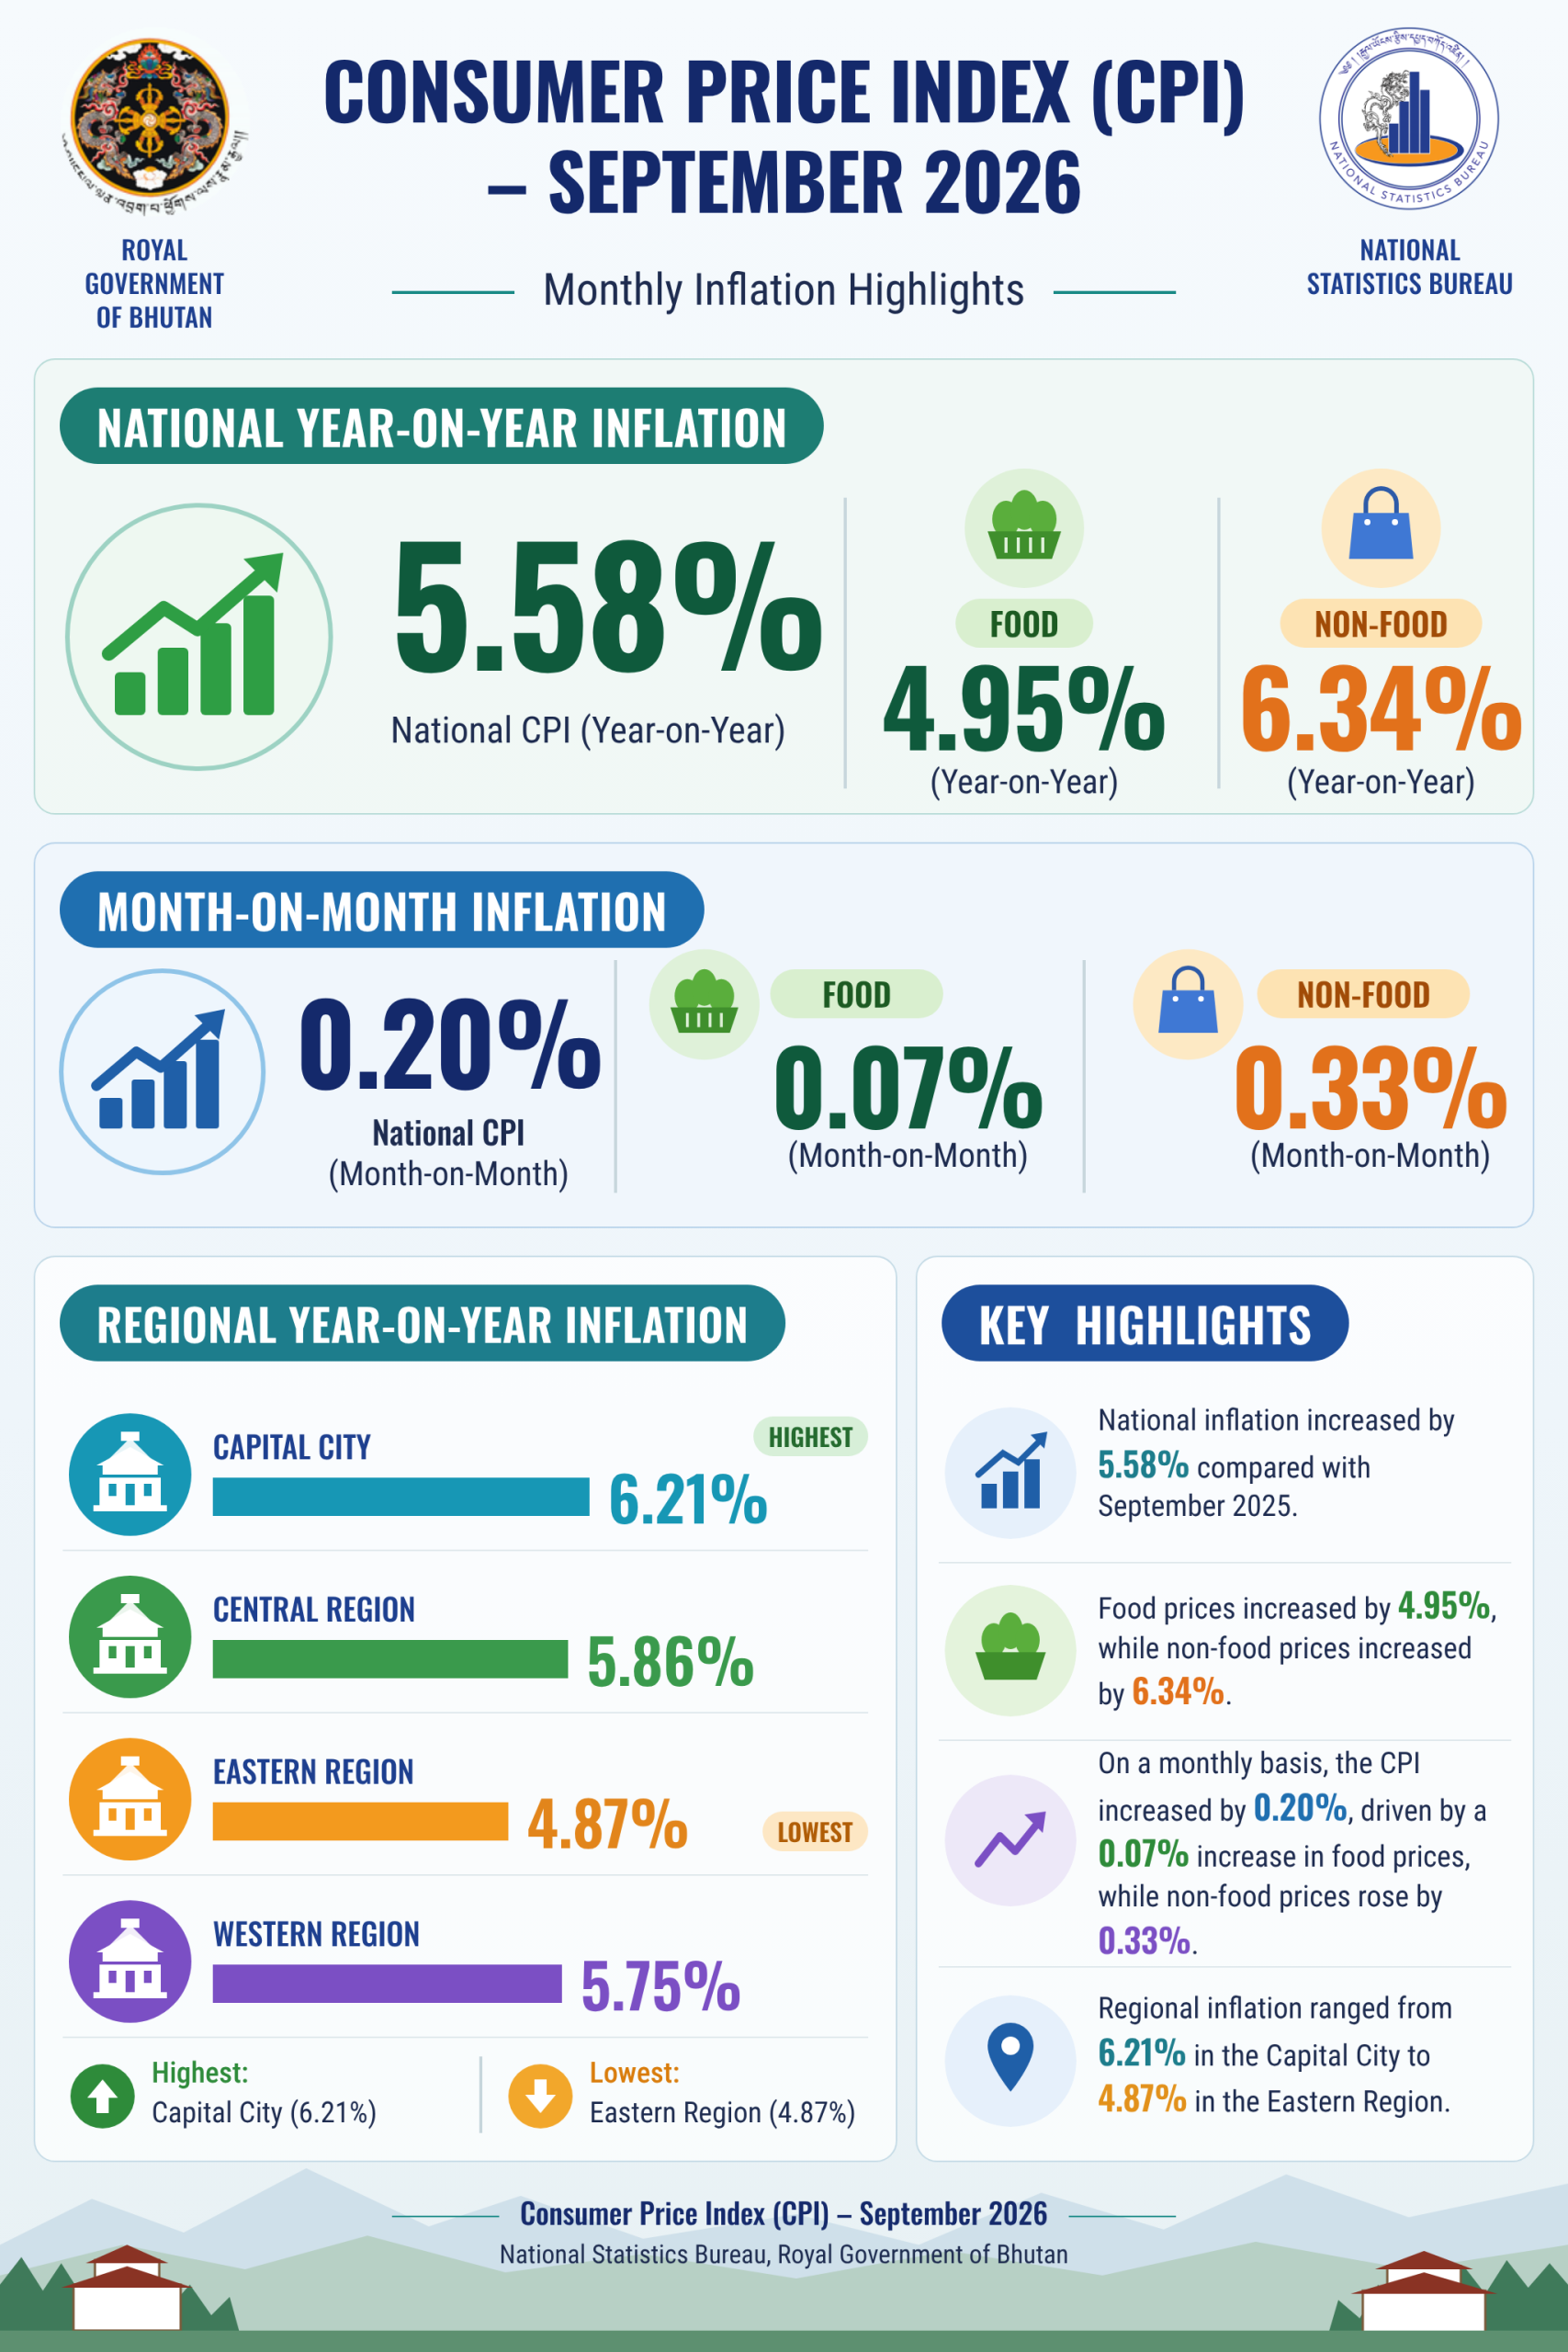
Consumer Price Index, March 2026
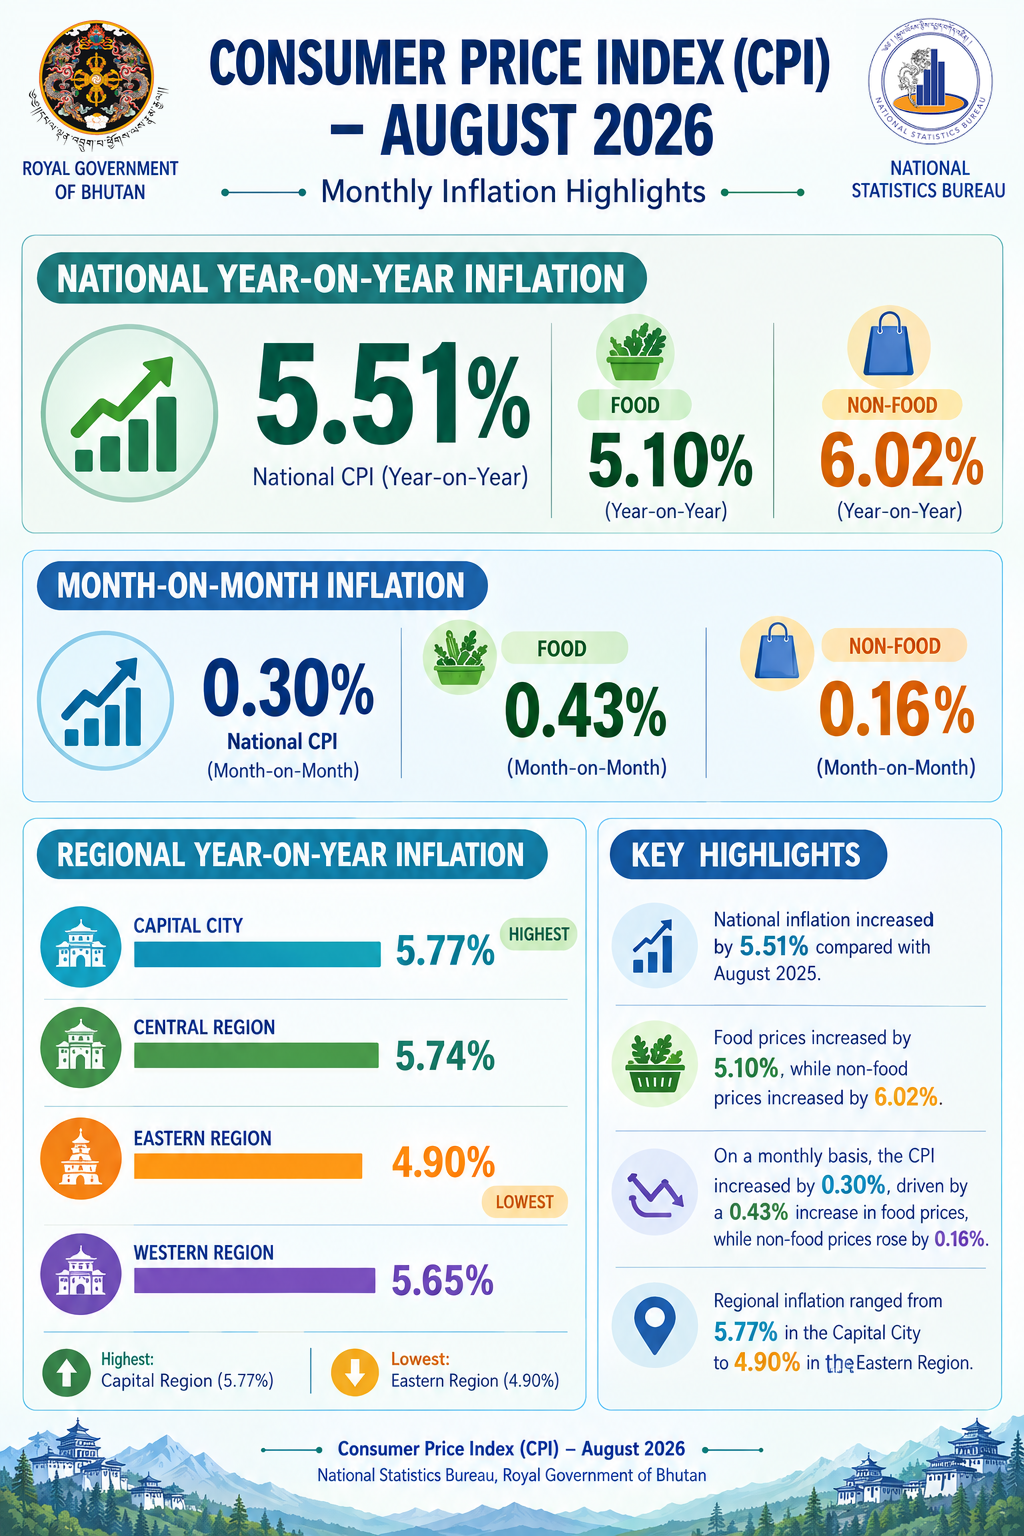
The headline inflation in March increased to 6.07 percent.
![]()
Vital Statistics Report 2025
The National Statistics Bureau releases the Vital Statistics Report 2025.
![]()
Censuses and Surveys
Announcements
Other Features
Access our all exclusive data features for major specific indicators
Events in May 2026
| MonMonday | TueTuesday | WedWednesday | ThuThursday | FriFriday | SatSaturday | SunSunday |
|---|---|---|---|---|---|---|
April 27, 2026
|
April 28, 2026
|
April 29, 2026
|
April 30, 2026
|
May 1, 2026
|
May 2, 2026
|
May 3, 2026
|
May 4, 2026
|
May 5, 2026
|
May 6, 2026
|
May 7, 2026
|
May 8, 2026
|
May 9, 2026
|
May 10, 2026
|
May 11, 2026
|
May 12, 2026
|
May 13, 2026
|
May 14, 2026
|
May 15, 2026
|
May 16, 2026
|
May 17, 2026
|
May 18, 2026
|
May 19, 2026
|
May 20, 2026
|
May 21, 2026
|
May 22, 2026
|
May 23, 2026
|
May 24, 2026
|
May 25, 2026
|
May 26, 2026
|
May 27, 2026
|
May 28, 2026
|
May 29, 2026
|
May 30, 2026
|
May 31, 2026
|
First Quarter Gross Domestic Product 2026
- 29 May 2026|
Socio-Economic Indicators for 1st Quarter, 2026
- 15 May 2026|
Consumer Price Index, March 2026
- 30 April 2026|
Vital Statistics Report 2025
- 29 April 2026|
Download the App for fast, free easy access to commonly used statistics. More than 200 charts are made available from 28 data categories.